Normal Distribution Calculator
Normal Distribution Calculator
Probability, z-score, percentile and inverse normal calculations with a live bell-curve visualization.
Inputs
Calculation
Mean (μ)any real value
Standard deviation (σ)must be > 0
X valueobserved value
Lower value (a)
Upper value (b)
Percentile / cumulative probability97.5%
Enter as a percentage from 0 to 100.
Results
Probability
0.975002
97.5002%
Z-score
1.9600
(x − μ) / σ
PDF at x
0.058441
density
Complement
0.024998
2.4998%
Normal density
Selected probability area
−1 to 1
≈68.27% within μ ± 1σ
−2 to 2
≈95.45% within μ ± 2σ
−3 to 3
≈99.73% within μ ± 3σ
How this is calculated
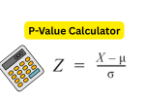
The calculator standardizes values with z = (x − μ) / σ. Probabilities are areas under the normal density curve, and inverse calculations solve for the quantile corresponding to a chosen cumulative probability.
This Normal Distribution Calculator helps students, researchers, analysts, and educators calculate normal probabilities, z-scores, percentile values, and inverse normal quantiles from a mean and standard deviation. It supports left-tail, right-tail, between-range, outside-range, and percentile calculations, with instant interpretation and a visual normal curve so results can be checked and communicated clearly in research and statistical analysis.
researchmethod.net