
A moderating variable, or moderator, changes the strength or direction of the relationship between an independent variable and a dependent variable. It helps researchers determine when, for whom, or under what conditions an association occurs. Moderation is usually tested by adding an interaction term to a regression model.

Introduction
A study may show that one variable is related to another, but the relationship may not be equally strong for every person, group, place, or situation. Exercise, for example, may improve wellbeing more strongly for people with high social support than for those with low social support. Social support would therefore be a possible moderator.
Understanding moderators allows researchers to move beyond average effects. Instead of asking only whether (X) predicts (Y), moderation research asks whether the effect of (X) on (Y) depends on a third variable.
This article explains what a moderating variable is, how it differs from other third variables, how to formulate a moderation hypothesis, and how to test, interpret, and report moderation appropriately.
Key Takeaways
- A moderator changes the strength, direction, or presence of a relationship.
- Moderators answer questions about when, where, under what conditions, or for whom an effect occurs.
- Moderation is usually represented statistically by an interaction between a predictor and a moderator.
- A significant interaction should be interpreted using conditional effects, confidence intervals, and a graph.
- Centering may improve interpretation but is not required to test moderation.
- A statistical interaction does not, by itself, establish a causal moderating process.
What Is a Moderating Variable?
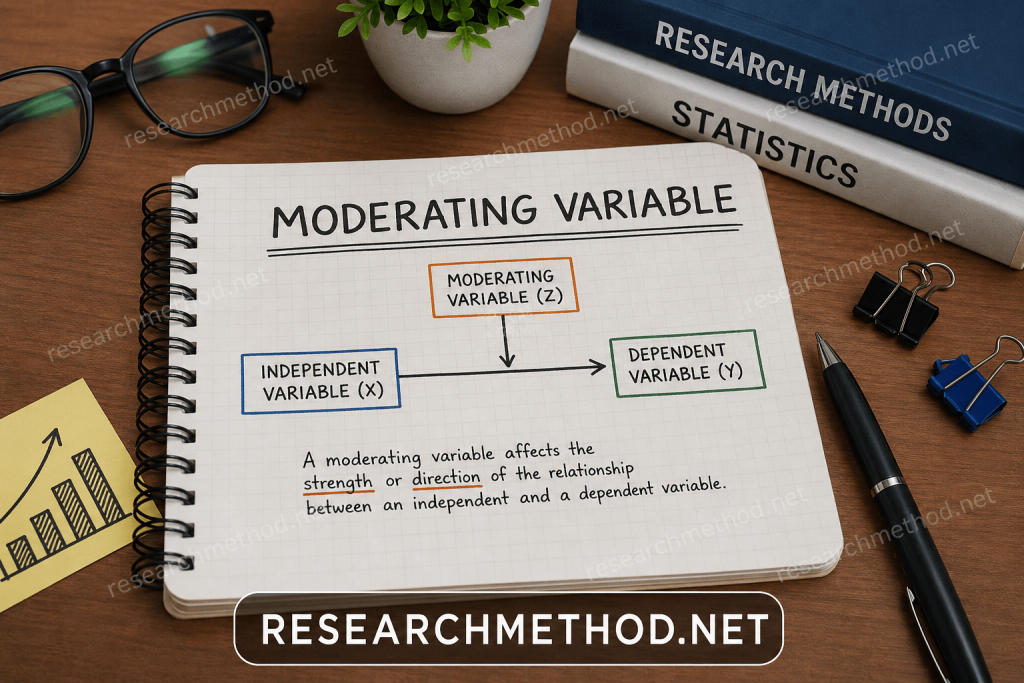
A moderating variable is a variable that changes the relationship between two other variables. It may make the relationship stronger, weaker, absent, or reversed.
Suppose a researcher studies whether study time predicts examination performance:
- Independent variable: Study time
- Dependent variable: Examination performance
- Possible moderator: Prior subject knowledge
Study time may be strongly related to performance among students with little prior knowledge but only weakly related to performance among students who already understand the subject. In that case, prior knowledge moderates the study-time–performance relationship.
The classic distinction developed by Baron and Kenny (1986) is that a moderator describes variation in the strength or direction of a relationship, whereas a mediator describes the process through which an effect occurs.
The Conditional-Effect Idea
Moderation means that the effect of (X) is conditional on the value of another variable, (W).
Instead of saying:
Study time improves examination performance.
A moderation model says:
The relationship between study time and examination performance depends on students’ prior knowledge.
The effect of study time is therefore not assumed to be constant across all values of prior knowledge.
Conceptual Representation
A simple moderation model contains:
- (X): predictor or independent variable
- (Y): outcome or dependent variable
- (W): moderator
- (X \times W): interaction between the predictor and moderator
In a conceptual diagram, (X) points towards (Y), while (W) points towards the relationship between (X) and (Y).
How Does a Moderating Variable Work?
A moderator works by making the slope between a predictor and outcome different at different values or categories of the moderator.
For example, imagine that workload is negatively associated with job satisfaction. The negative relationship may be:
- Strong among employees with low organisational support.
- Moderate among employees with average support.
- Weak among employees with high support.
Organisational support does not necessarily explain the mechanism through which workload affects satisfaction. Instead, it identifies a condition under which the association becomes stronger or weaker.
Common Patterns of Moderation
Strengthening Moderation
The relationship between (X) and (Y) becomes stronger as the moderator increases.
Example: The positive relationship between training and performance may be stronger when employee motivation is high.
Weakening or Buffering Moderation
The moderator reduces the strength of a relationship.
Example: Social support may weaken the negative relationship between stress and psychological wellbeing.
Knockout Moderation
The relationship is present at one level of the moderator but approximately absent at another level.
Example: A teaching intervention may improve achievement among students with low prior knowledge but have little effect among students who have already mastered the material.
Crossover Moderation
The relationship changes direction across values of the moderator.
Example: Competitive pressure may improve performance among experienced employees but reduce performance among inexperienced employees.
A crossover pattern should be interpreted carefully. Researchers should check whether the crossing point lies within the observed data and whether adequate observations exist around that point.
Examples of Moderating Variables
| Research field | Predictor (X) | Outcome (Y) | Possible moderator (W) | Moderation question |
|---|---|---|---|---|
| Education | Study time | Examination score | Prior knowledge | Is study time more beneficial for students with low prior knowledge? |
| Psychology | Stress | Anxiety symptoms | Social support | Is the stress–anxiety relationship weaker when social support is high? |
| Healthcare | Treatment | Symptom improvement | Baseline severity | Does treatment effectiveness depend on initial symptom severity? |
| Business | Training | Employee performance | Motivation | Is training more effective for highly motivated employees? |
| Marketing | Advertising exposure | Purchase intention | Brand familiarity | Does advertising work differently for familiar and unfamiliar brands? |
| Public health | Health information | Preventive behaviour | Health literacy | Is health information more influential among people with greater health literacy? |
| Technology | AI-tool use | Task performance | Digital competence | Does AI-tool use improve performance more for users with stronger digital skills? |
| Environmental research | Risk communication | Conservation behaviour | Trust in institutions | Does trust alter the effect of environmental messages on behaviour? |
These examples are hypotheses rather than established facts. A researcher must support the proposed moderator theoretically and test the relevant interaction empirically.
Moderator vs Mediator vs Confounder vs Control Variable
| Variable type | Main question answered | Position in the model | Typical statistical focus |
|---|---|---|---|
| Moderator | When, for whom, or under what conditions does the relationship change? | Changes the (X)-to-(Y) relationship | Interaction or conditional effect |
| Mediator | How or why does (X) influence (Y)? | Lies on a proposed pathway between (X) and (Y) | Indirect effect |
| Confounder | Could a third variable create or distort the observed relationship? | Related to the exposure and outcome in a way that biases estimation | Adjustment, design control, or causal identification |
| Control variable | What is the relationship after accounting for another variable? | Included to reduce alternative explanations or improve precision | Adjusted regression coefficient |
| Ordinary predictor | Does this variable contribute independently to predicting the outcome? | Has an additive association with (Y) | Main effect |
Moderator vs Mediator
A moderator changes an effect; a mediator transmits or explains an effect.
Consider a study of exercise and mood:
- Mediator: Exercise improves sleep, which then improves mood.
- Moderator: Exercise improves mood more strongly for people who have high social support.
The same measured variable can serve as a mediator in one theoretical model and a moderator in another. Its role depends on the research question, temporal ordering, causal assumptions, and statistical model.
Moderator vs Confounder
A moderator represents heterogeneity in a relationship. A confounder threatens the validity of an estimated relationship.
For example, age may moderate a treatment effect if the treatment works differently across age groups. Age may also act as a confounder in another study if it is associated with both treatment selection and the outcome. The label depends on the variable’s role in the specific design.
How to Identify a Possible Moderating Variable
A variable may be a plausible moderator when theory suggests that it changes the effect of one variable on another.
Ask the following questions:
- Does the proposed variable describe a person, group, environment, time, or condition under which the focal relationship may differ?
- Is there a theoretical reason for expecting different slopes or effects?
- Does previous research report inconsistent effects across populations or settings?
- Can the proposed moderator be measured reliably?
- Does it have sufficient variation in the intended sample?
- Can the proposed interaction be distinguished from confounding or subgroup selection?
- Will the analysis be confirmatory or exploratory?
A variable should not be labelled a moderator merely because its own regression coefficient is statistically significant. Moderation concerns the interaction, not simply the moderator’s independent association with the outcome.
How to Write a Moderation Hypothesis
A good moderation hypothesis identifies the predictor, outcome, moderator, and expected pattern.
General Template
H1: The relationship between (X) and (Y) will be moderated by (W), such that the relationship will be stronger/weaker/more positive/more negative when (W) is high than when (W) is low.
Education Example
H1: Prior knowledge will moderate the relationship between study time and examination performance, such that study time will be more strongly associated with performance among students with lower prior knowledge.
Business Example
H1: Perceived organisational support will moderate the relationship between workload and job satisfaction, such that the negative relationship will be weaker among employees reporting greater organisational support.
Non-Directional Hypothesis
When theory does not justify a direction:
H1: The relationship between workload and job satisfaction will vary as a function of perceived organisational support.
Non-directional hypotheses are legitimate, but the reason for expecting moderation should still be explained.
How to Test a Moderating Variable
Step 1: Specify the Theory and Variables
Identify:
- Predictor (X)
- Outcome (Y)
- Moderator (W)
- Relevant covariates
- Expected interaction pattern
- Confirmatory or exploratory status
Where possible, define the model before examining the results.
Step 2: Choose a Model Appropriate for the Outcome
Ordinary least squares regression is suitable when the dependent variable is continuous and the model assumptions are reasonably satisfied.
Other outcomes may require:
- Logistic regression for binary outcomes.
- Ordinal regression for ordered categories.
- Poisson or negative-binomial regression for counts.
- Multilevel modelling for clustered or repeated observations.
- Survival models for time-to-event outcomes.
- Structural equation modelling when latent constructs or measurement models are required.
The interaction remains central, but its interpretation may differ across model types and measurement scales.
Step 3: Code the Variables Correctly
Continuous predictors may be retained in their original units, centered, or rescaled.
Binary moderators are commonly coded using an indicator such as:
- 0 = comparison group
- 1 = focal group
An unordered moderator with (k) categories normally requires (k-1) indicator variables. Each indicator may need its own interaction with the predictor.
Do not enter arbitrary numeric category labels such as 1, 2, and 3 as though they were a continuous scale unless equal spacing and a linear trend are substantively defensible.
Step 4: Examine Data Quality
Before fitting the model, assess:
- Missing data.
- Impossible or miscoded values.
- Outliers and influential observations.
- Reliability of multi-item measures.
- Distribution and range of the moderator.
- Sparse categories.
- Whether the predictor and moderator overlap sufficiently across their ranges.
A mathematical interaction can be estimated even when data support is weak, but interpretation may become unstable or extrapolative.
Step 5: Decide Whether Centering Is Useful
Mean-centering subtracts the sample mean from a continuous variable:
[
X_c = X-\bar{X}
]
Centering is often useful because zero then represents the sample mean. The coefficient for (X_c) can be interpreted as the effect of (X) when the centered moderator is at its mean.
However, centering:
- Is not required to test an interaction.
- Does not change the fitted values or overall interaction test when the model is specified equivalently.
- Does not automatically solve structural collinearity.
- Should not replace proper diagnostics or better study design.
Standardising a variable additionally divides by its standard deviation. Centering and standardising are not the same operation.
Step 6: Create and Fit the Interaction Model
The basic linear moderation model is:
[
Y=\beta_0+\beta_1X+\beta_2W+\beta_3(XW)+\varepsilon
]
Where:
- (Y) is the outcome.
- (X) is the predictor.
- (W) is the moderator.
- (XW) is the interaction term.
- (\beta_0) is the intercept.
- (\beta_1) is the effect of (X) when (W=0).
- (\beta_2) is the effect of (W) when (X=0).
- (\beta_3) shows how much the slope of (X) changes for a one-unit increase in (W).
- (\varepsilon) is the residual.
The conditional effect of (X) at a particular value of (W=w) is:
[
\frac{\partial Y}{\partial X}=\beta_1+\beta_3w
]
This equation is central to interpreting moderation.
Step 7: Evaluate the Interaction
Examine:
- The estimated interaction coefficient.
- Its standard error.
- Confidence interval.
- Test statistic and p-value, where used.
- Change in model fit or explained variance.
- Practical importance.
- Robustness to reasonable alternative specifications.
A confidence interval excluding zero provides evidence against a zero interaction coefficient under the assumptions of the model. It does not automatically prove the proposed causal explanation.
Step 8: Probe the Interaction
A significant or substantively important interaction should normally be probed.
Common approaches include:
- Conditional effects at meaningful moderator values.
- Simple slopes at low, average, and high moderator values.
- Group-specific slopes for categorical moderators.
- Johnson–Neyman regions for continuous moderators.
- Predicted-value plots with confidence intervals.
Avoid interpreting only the sign of (\beta_3). The observed pattern depends on the interaction coefficient, main-effect coefficients, variable coding, measurement scale, and range of the data.
Step 9: Plot the Interaction
An interaction plot should show:
- The predictor on the horizontal axis.
- The predicted outcome on the vertical axis.
- Separate lines or curves for meaningful moderator values or groups.
- Observed data ranges.
- Confidence intervals where possible.
Nonparallel lines suggest that the slope differs across moderator values. The lines do not need to cross for an interaction to exist.
Step 10: Conduct Sensitivity and Diagnostic Checks
Check:
- Linearity or correct functional form.
- Residual behaviour.
- Heteroskedasticity.
- Influential observations.
- Multicollinearity.
- Model specification.
- Sparse data.
- Measurement reliability.
- Alternative codings and theoretically plausible covariates.
- Whether conclusions depend on a small number of cases.
Robust standard errors may help with some forms of heteroskedasticity, but they cannot repair poor measurement, severe model misspecification, confounding, or inadequate data support.
Continuous and Categorical Moderators
Continuous Moderator
Examples include age, income, stress, motivation, and social-support scores.
The interaction coefficient indicates how the predictor’s slope changes as the moderator increases by one unit. Because one unit may not always be meaningful, researchers often report conditional effects at substantively relevant values.
Using only “one standard deviation below the mean,” “the mean,” and “one standard deviation above the mean” is convenient but not compulsory. Clinically meaningful cut-offs, scale anchors, percentiles, or Johnson–Neyman regions may be more informative.
Binary Moderator
A binary moderator compares two groups or conditions.
Suppose:
- (W=0): traditional teaching
- (W=1): digital teaching
Then:
- The slope of (X) in the traditional group is (\beta_1).
- The slope of (X) in the digital group is (\beta_1+\beta_3).
- (\beta_3) is the difference between those two slopes.
Multicategorical Moderator
For three unordered groups, two indicator variables are normally used when one group serves as the reference category.
The model contains:
- Predictor (X)
- Two group indicators
- (X) multiplied by each group indicator
The interaction terms test whether each non-reference group’s slope differs from the reference group’s slope. An omnibus test may be used to assess the interaction as a whole.
Simple Slopes and the Johnson–Neyman Technique
Simple Slopes
Simple-slopes analysis estimates the effect of (X) at selected values of (W).
For example:
- Low social support.
- Average social support.
- High social support.
Each slope should be reported with an estimate, standard error or confidence interval, and appropriate inferential test.
A significant slope at one moderator value and a nonsignificant slope at another does not automatically prove that the two slopes differ. The interaction term directly tests whether the slopes differ.
Johnson–Neyman Technique
The Johnson–Neyman technique identifies values of a continuous moderator at which the conditional effect of the predictor becomes statistically distinguishable from zero under the fitted model.
It can be more informative than selecting only three arbitrary moderator values because it evaluates the conditional effect across the moderator’s range.
Researchers should report:
- The estimated transition point or region.
- Whether it falls within the observed moderator range.
- How much data exist in the relevant region.
- Confidence intervals and the model used.
- Any adjustment made for multiple testing.
Do not interpret Johnson–Neyman regions outside the observed data range as evidence about populations not represented in the study.
Assumptions and Practical Checks
Moderation analysis inherits the assumptions of the underlying statistical model.
For ordinary linear regression, important considerations include:
- A correctly specified functional form.
- Independent observations unless dependence is modelled.
- Approximately constant residual variance or suitable robust inference.
- No single observation exerting unreasonable influence.
- Adequate variation in the predictor and moderator.
- Reliable measurement.
- Sufficient sample size and data coverage.
- Appropriate treatment of missing data.
- No serious omitted-variable problem for the intended interpretation.
Normality of the raw variables is not itself a general requirement of linear regression. For small-sample significance tests, the residual distribution and model assumptions are more relevant.
Sample Size and Statistical Power
There is no universal minimum sample size for moderation analysis.
Power depends on:
- The expected interaction size.
- Main-effect sizes.
- Correlation between the predictor and moderator.
- Reliability of the measures.
- Continuous or categorical measurement.
- Group balance.
- Variable distributions.
- Number of covariates.
- Outcome model.
- Missing data.
- Chosen significance level.
Interaction effects in observational research are often modest and can be difficult to estimate precisely. Researchers should therefore conduct a design-specific power analysis rather than applying a generic rule such as “ten participants per variable.”
Simulation-based tools can be especially useful when predictors are correlated, measures are unreliable, groups are unequal, or variables are not normally distributed.
Hypothetical Interpretation Example
A researcher tests whether social support moderates the relationship between work stress and job satisfaction. Both continuous variables are mean-centered.
The estimated interaction is:
[
b_{\text{stress}\times\text{support}}=0.18,\quad 95%,CI[0.07,0.29]
]
Because the interaction is positive, the negative association between stress and satisfaction becomes less negative as social support increases.
Hypothetical conditional effects are:
- Low support: (b=-0.62)
- Average support: (b=-0.41)
- High support: (b=-0.20)
The interpretation is not that social support completely prevents the effects of stress. The model indicates that the negative stress–satisfaction association is weaker at higher observed levels of support.
A responsible report would also include uncertainty estimates, sample information, diagnostics, an interaction plot, and the observational or experimental nature of the design.
Advantages of Using Moderating Variables
Moderation analysis can:
- Identify groups or conditions for which an effect is stronger or weaker.
- Explain variation across studies or settings.
- Reveal limitations of an average effect.
- Improve theory by identifying boundary conditions.
- Support targeted interventions or policies.
- Test whether treatment effects differ across pre-specified subgroups.
- Connect individual characteristics with environmental conditions.
- Generate more precise research questions.
Limitations of Moderation Analysis
Important limitations include:
- Interactions may require substantial statistical power.
- Measurement error can weaken interaction estimates.
- Results can depend on coding and scale.
- Searching many possible moderators increases false-positive risk.
- Subgroups may contain too few observations.
- Observational interactions do not establish causal effect modification.
- Conditional effects may be extrapolated beyond observed data.
- Complex models can become difficult to explain and replicate.
- Significant interactions may have little practical importance.
- Nonsignificant interactions may reflect low precision rather than evidence of no moderation.
Common Mistakes
Treating a Main Effect as Moderation
A statistically significant coefficient for (W) does not establish moderation. The relevant test concerns (XW).
Removing Lower-Order Terms Without Justification
Models containing an interaction normally retain the corresponding lower-order terms. Removing them changes the model’s meaning and imposes constraints that may be inappropriate.
Splitting a Continuous Moderator Into “High” and “Low” Groups
Dichotomising a continuous moderator usually discards information, reduces power, and creates arbitrary categories. Retain the continuous form unless a defensible threshold exists.
Assuming Centering Creates Moderation
Centering changes the reference point for interpretation. It does not create or remove the underlying interaction.
Reporting Only the Interaction p-Value
Readers also need the coefficient, confidence interval, conditional effects, graph, coding details, and model assumptions.
Choosing Moderators After Examining Many Results
Unplanned searches can generate chance findings. Exploratory moderation is useful, but it should be labelled as exploratory and ideally validated in new data.
Claiming Causality From Cross-Sectional Data
A statistical interaction in cross-sectional observational data describes conditional association under the model. Stronger causal language requires design and assumptions that justify it.
Moderating Variables in Modern Research
Moderators are increasingly important in research that asks whether average effects conceal meaningful heterogeneity.
Applications include:
- Personalised healthcare and treatment-response research.
- Adaptive educational interventions.
- Digital and mobile-health studies.
- Workplace and organisational research.
- Cross-cultural research.
- Public-policy evaluation.
- Human–AI interaction.
- Fairness and performance evaluation of predictive systems.
- Multilevel and longitudinal studies.
- Meta-analysis and evidence synthesis.
Modern research also uses three-way interactions, cross-level moderation, latent-variable interactions, time-varying moderators, and moderated mediation. These models should be used only when they answer a clear theoretical question and the available data can support the additional complexity.
Software for Moderation Analysis
SPSS PROCESS
PROCESS can estimate simple moderation, moderated mediation, and other conditional-process models. For a simple single-moderator model, researchers commonly use Model 1.
The software does not replace the need to understand:
- Variable coding.
- Regression assumptions.
- The meaning of conditional effects.
- Causal limitations.
- Appropriate reporting.
R
Base R can estimate a moderation model using a formula such as:
model <- lm(outcome ~ predictor * moderator, data = study_data)
The asterisk adds the predictor, moderator, and interaction. Packages such as interactions, marginaleffects, and related tools can support plotting, simple slopes, predictions, and Johnson–Neyman analyses.
jamovi
The GAMLj module provides graphical tools for linear, generalized, and mixed models, including interactions, simple slopes, confidence intervals, and plots.
JASP
JASP can test interactions using frequentist or Bayesian regression. Researchers should still verify coding, prior settings where relevant, model assumptions, and the interpretation of the chosen scale.
Structural Equation Modelling
SEM may be useful when moderators or outcomes are latent constructs, measurement error must be modelled explicitly, or moderation is embedded in a larger theoretical model. Latent interactions require additional expertise and are not identical to multiplying observed composite scores.
Using Artificial Intelligence Responsibly
Generative AI can assist with:
- Explaining unfamiliar output.
- Drafting commented code.
- Converting analysis syntax between programs.
- Suggesting diagnostic checks.
- Improving the clarity of a results paragraph.
- Creating an initial interaction-diagram description.
AI should not be trusted to:
- Choose a moderator without theoretical justification.
- Invent missing data or results.
- Determine causality from a coefficient table.
- Verify assumptions without access to the data.
- Replace statistical review.
- Generate unverified citations.
- Interpret confidential data in an insecure public system.
Researchers should inspect every command, reproduce the analysis independently, document software versions and options, and verify all cited sources.
How to Report Moderation Results
A moderation report should identify:
- The predictor, moderator, and outcome.
- Coding and centering decisions.
- Statistical model and software.
- Covariates.
- Interaction coefficient.
- Standard error and confidence interval.
- Test statistic and p-value where required.
- Model fit or change in explained variance.
- Conditional effects.
- Johnson–Neyman findings where used.
- Interaction plot.
- Diagnostics and limitations.
APA-Style Reporting Template
A moderation analysis was conducted to examine whether [moderator] changed the relationship between [predictor] and [outcome]. [Describe centering and coding]. The predictor-by-moderator interaction was [statistically significant/not statistically significant], (b=)[value], (SE=)[value], 95% CI [lower, upper], (p=)[value]. Conditional-effect analysis indicated that the association between [predictor] and [outcome] was [describe pattern] at [moderator values or groups]. These results [supported/did not support] the hypothesised moderation pattern.
Where possible, report exact p-values rather than only writing (p<.05).
Conclusion
A moderating variable indicates that the relationship between a predictor and outcome is not constant across all people or conditions. It is usually tested through an interaction term and interpreted using conditional effects and visualisation.
Strong moderation research begins with theory, uses appropriate coding and power planning, examines assumptions, reports uncertainty, and avoids treating a statistical interaction as automatic proof of a causal process.
References
- Aiken, L. S., & West, S. G. (1991). Multiple regression: Testing and interpreting interactions. SAGE Publications.
- Baranger, D. A. A., Finsaas, M. C., Goldstein, B. L., Vize, C. E., Lynam, D. R., & Olino, T. M. (2023). Tutorial: Power analyses for interaction effects in cross-sectional regressions. Advances in Methods and Practices in Psychological Science, 6(3). https://doi.org/10.1177/25152459231187531
- Baron, R. M., & Kenny, D. A. (1986). The moderator–mediator variable distinction in social psychological research: Conceptual, strategic, and statistical considerations. Journal of Personality and Social Psychology, 51(6), 1173–1182. https://doi.org/10.1037/0022-3514.51.6.1173
- Bauer, D. J., & Curran, P. J. (2005). Probing interactions in fixed and multilevel regression: Inferential and graphical techniques. Multivariate Behavioral Research, 40(3), 373–400. https://doi.org/10.1207/S15327906MBR4003_5
- Cohen, J., Cohen, P., West, S. G., & Aiken, L. S. (2003). Applied multiple regression/correlation analysis for the behavioral sciences (3rd ed.). Lawrence Erlbaum Associates.
- Dawson, J. F. (2014). Moderation in management research: What, why, when, and how. Journal of Business and Psychology, 29(1), 1–19. https://doi.org/10.1007/s10869-013-9308-7
- Hayes, A. F. (2022). Introduction to mediation, moderation, and conditional process analysis: A regression-based approach (3rd ed.). Guilford Press.
- Olvera Astivia, O. L., & Kroc, E. (2019). Centering in multiple regression does not always reduce multicollinearity: How to tell when your estimates will not benefit from centering. Educational and Psychological Measurement, 79(5), 813–826. https://doi.org/10.1177/0013164418817801
- Preacher, K. J., Curran, P. J., & Bauer, D. J. (2006). Computational tools for probing interactions in multiple linear regression, multilevel modeling, and latent curve analysis. Journal of Educational and Behavioral Statistics, 31(4), 437–448. https://doi.org/10.3102/10769986031004437
- Rohrer, J. M., & Arslan, R. C. (2021). Precise answers to vague questions: Issues with interactions. Advances in Methods and Practices in Psychological Science, 4(2). https://doi.org/10.1177/25152459211007368
Official Software and Methodological Resources
- Hayes, A. F. (n.d.). The PROCESS macro for SPSS, SAS, and R. Retrieved June 22, 2026, from https://www.processmacro.org/
- JASP Team. (n.d.). Mediation and moderation analysis in JASP. Retrieved June 22, 2026, from https://jasp-stats.org/2020/03/12/mediation-and-moderation-analysis-in-jasp/
- Selker, R., Love, J., Dropmann, D., & Moreno, V. (n.d.). GAMLj: General analyses for linear models in jamovi. Retrieved June 22, 2026, from https://gamlj.github.io/


